Business Context & Problem
Business data can come from different sources and formats, making it difficult to collect, process, prepare, and analyze that data through a unified workflow.
System Solution
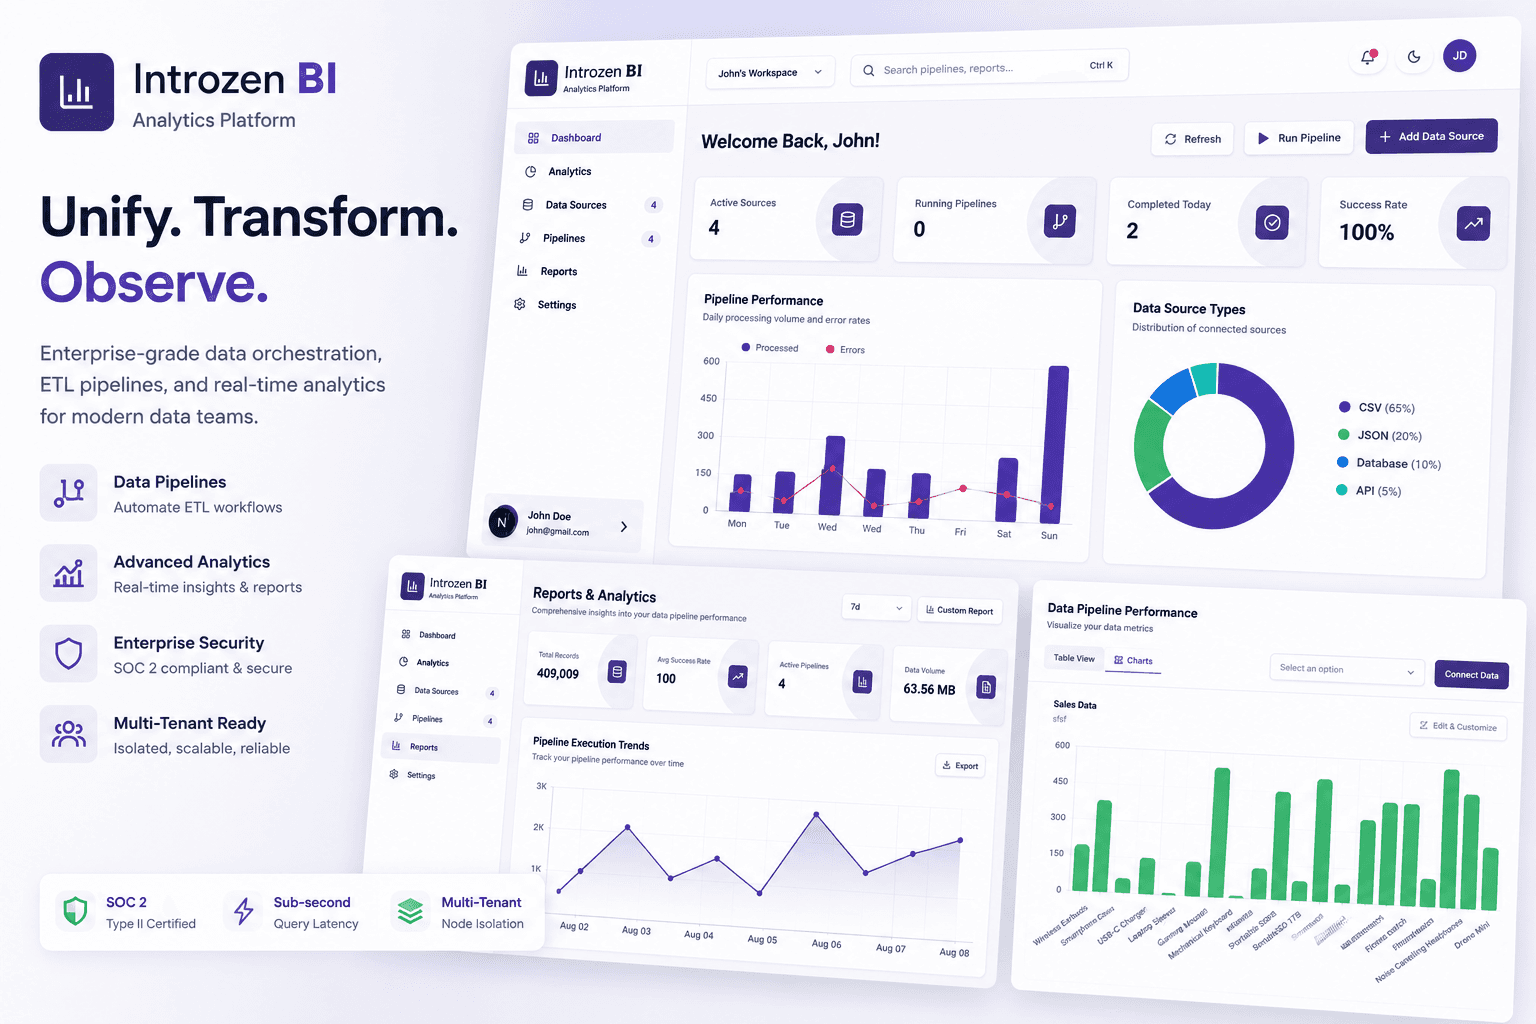
IntroZen BI provides a centralized platform for adding data sources, building ETL pipelines, extracting and processing data, preparing datasets for analysis, and exploring the resulting data through tables and visualizations.
Architecture & Engineering Execution
IntroZen BI uses Django for the backend, Celery and Redis for asynchronous data-processing workflows, Parquet for structured data handling, and a Next.js frontend for managing pipelines and exploring processed datasets through tables and visualizations. The application is containerized with Docker.
Key Engineering Challenges
ETL Pipeline Execution
Data extraction and processing tasks can be resource-intensive and should not block normal application requests.
Used Celery with Redis to handle data-processing workflows asynchronously in the background.
Created a foundation for executing data-processing tasks independently from the main application request cycle.
Data Processing & Preparation
Raw extracted data needs to be processed into a structured format that can be efficiently explored and visualized.
Built the data workflow around processing and preparing datasets for downstream analysis and visualization, including Parquet-based data handling.
Made processed datasets available for exploration through tables and visualizations.
Data Visualization
Processed datasets need to be presented in a way that makes business data easier to explore and understand.
Built interactive data views using tables and chart-based visualizations in the Next.js frontend.
Provided users with a visual interface for exploring processed data.
Core System Capabilities
- Data source management
- ETL pipeline building
- Data extraction
- Data transformation
- Data processing
- Dataset preparation
- Parquet-based data handling
- Processed data tables
- Interactive charts and visualizations