Observability has become one of the most important areas in modern software engineering. Building APIs is no longer enough. Engineers now need to understand how systems behave under real production traffic, how to measure performance, detect bottlenecks, and monitor infrastructure health.
In this guide, we will explore how Prometheus and Grafana work together to create a complete observability stack for backend systems.
What is Observability?
Observability is the ability to understand the internal state of a system by analyzing its outputs such as:
- Metrics
- Logs
- Traces
- Performance data
- Error rates
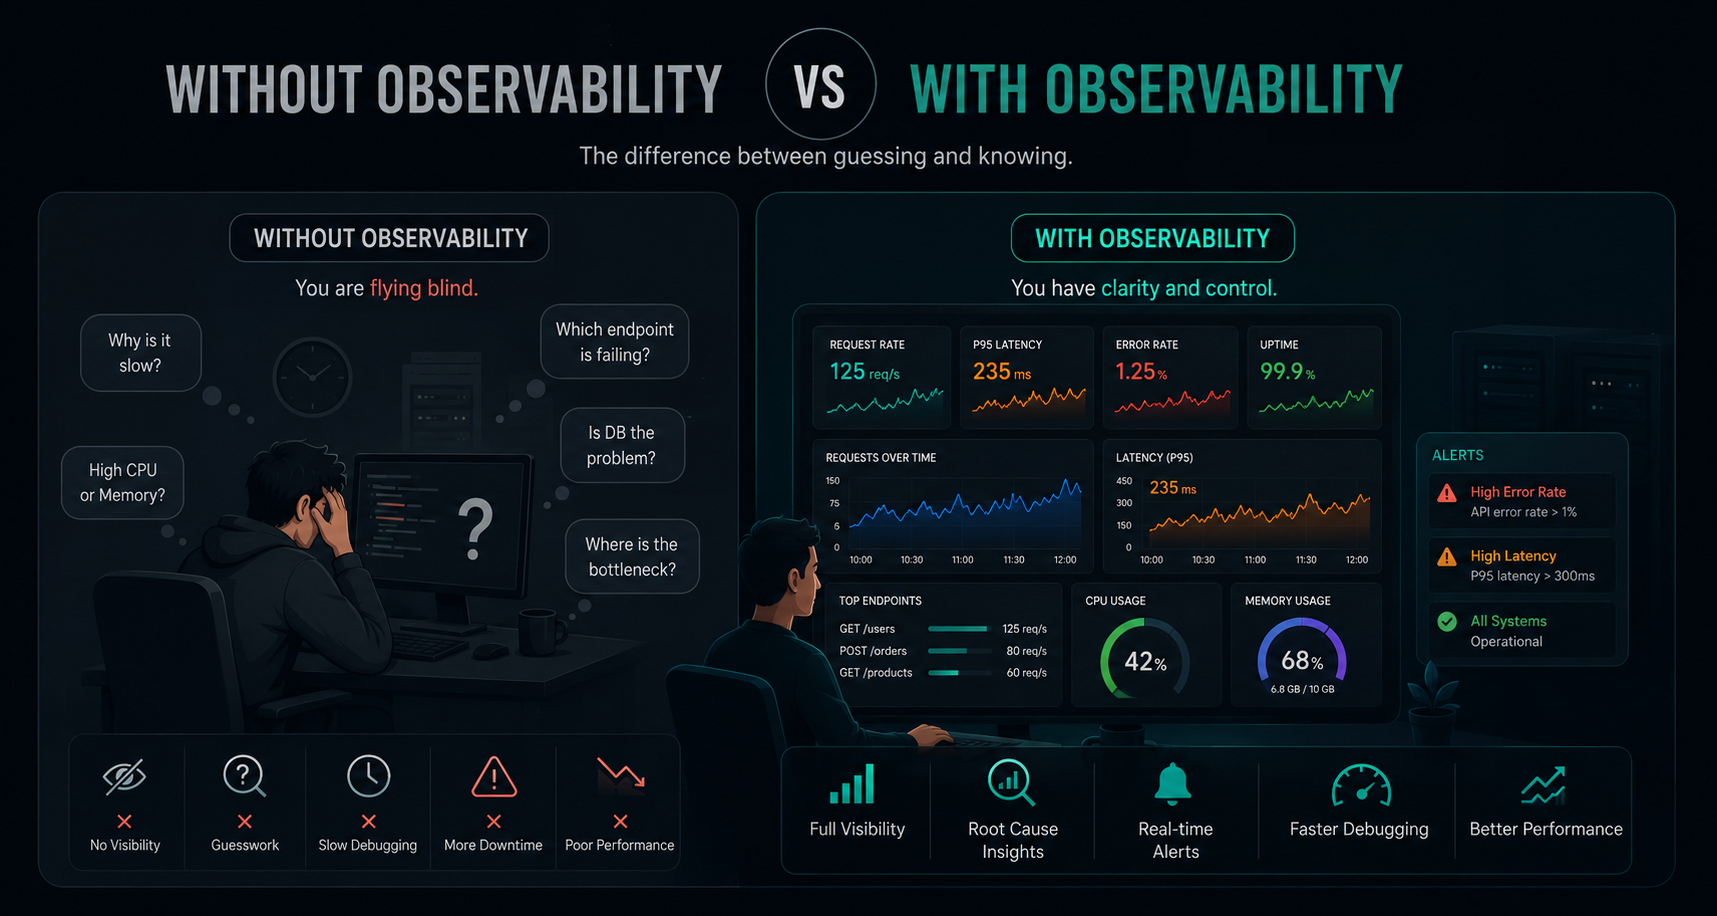
Instead of guessing why systems become slow or unstable, observability allows engineers to investigate issues using real measurable data.
Why Observability Matters
- Detect performance bottlenecks early.
- Monitor infrastructure health.
- Understand API latency and throughput.
- Prevent outages and downtime.
- Scale systems more confidently.
- Optimize resource usage and cost.
Modern backend engineering is increasingly data driven. Metrics are now part of software architecture itself.
What is Prometheus?
Prometheus is an open source monitoring and time series database system designed for collecting and storing metrics from applications and infrastructure.
Prometheus continuously collects metrics from systems using a pull based model.
Prometheus Core Workflow
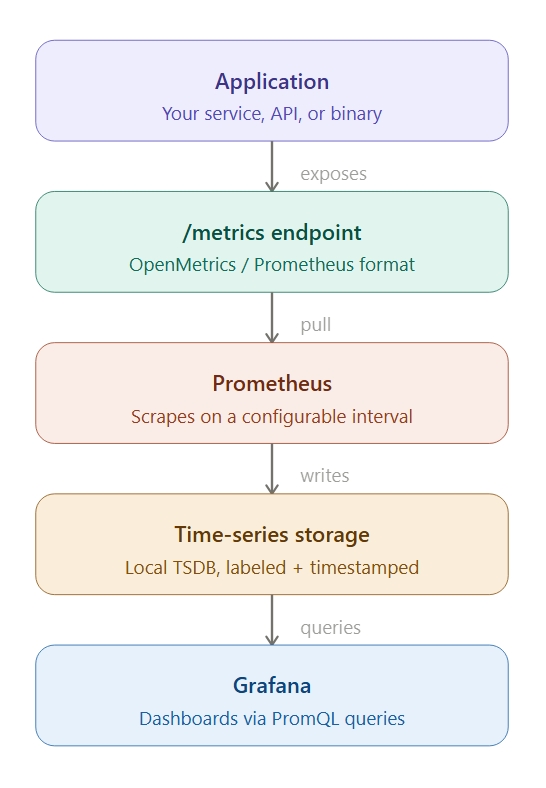
Applications expose metrics through a /metrics endpoint, and Prometheus periodically scrapes those metrics at configured intervals.
Understanding Metrics
Metrics are numerical measurements collected over time.
Common Metric Types
| Type | Description |
|---|---|
| Counter | Only increases over time. |
| Gauge | Can increase or decrease. |
| Histogram | Measures distributions like latency. |
| Summary | Tracks statistical summaries. |
Example Metrics
http_requests_total 1520
memory_usage_bytes 104857600
http_request_duration_seconds
Understanding Time-Series Data
Prometheus stores metrics as time-series data.
Each metric contains:
- Metric name
- Timestamp
- Value
- Labels
Example
http_requests_total{
  method="GET",
  endpoint="/users"
}
Labels make metrics extremely powerful because they allow filtering and grouping.
What is Grafana?
Grafana is a visualization platform used to build dashboards and graphs from monitoring data.
Grafana itself does not usually collect metrics directly. Instead, it connects to data sources such as Prometheus.
Grafana Responsibilities
- Visual dashboards
- Performance graphs
- Latency analysis
- Infrastructure monitoring
- Alert visualization
- System health tracking
FastAPI + Prometheus Integration
One of the easiest ways to start learning observability is by instrumenting a FastAPI application.
Install Dependencies
pip install fastapi uvicorn prometheus-fastapi-instrumentator
Example FastAPI Monitoring Setup
from fastapi import FastAPI
from prometheus_fastapi_instrumentator import Instrumentator
app = FastAPI()
Instrumentator().instrument(app).expose(app)
@app.get("/")
def home():
    return {"message": "Monitoring Enabled"}
This automatically creates a Prometheus compatible /metrics endpoint.
Prometheus Configuration
Prometheus needs a scrape configuration that defines which applications to monitor.
global:
  scrape_interval: 5s
scrape_configs:
  - job_name: "fastapi"
    static_configs:
      - targets: ["host.docker.internal:8000"]
Understanding PromQL
PromQL is the query language used by Prometheus.
PromQL allows engineers to analyze system behavior in real time.
Basic Query
http_requests_total
Request Rate
rate(http_requests_total[1m])
Average Request Duration
rate(http_request_duration_seconds_sum[1m])
/
rate(http_request_duration_seconds_count[1m])
P95 Latency
histogram_quantile(
  0.95,
  rate(http_request_duration_seconds_bucket[5m])
)
Understanding Latency Percentiles
Latency percentiles are critical in production systems.
- P50: Median response time.
- P95: 95% of requests are faster than this value.
- P99: Shows worst-case performance spikes.
High percentile latency often reveals hidden scaling problems.
Infrastructure Monitoring
Prometheus can also monitor infrastructure using exporters.
Common Exporters
- Node Exporter
- Redis Exporter
- PostgreSQL Exporter
- Docker Exporter
- Kubernetes Metrics Server
This enables full stack monitoring across applications, containers, and servers.
Load Testing with k6
Monitoring becomes more meaningful when systems experience real load.
k6 is a modern load testing tool used to simulate concurrent traffic.
Simple k6 Example
import http from 'k6/http';
export default function () {
  http.get('http://localhost:8000');
}
By combining:
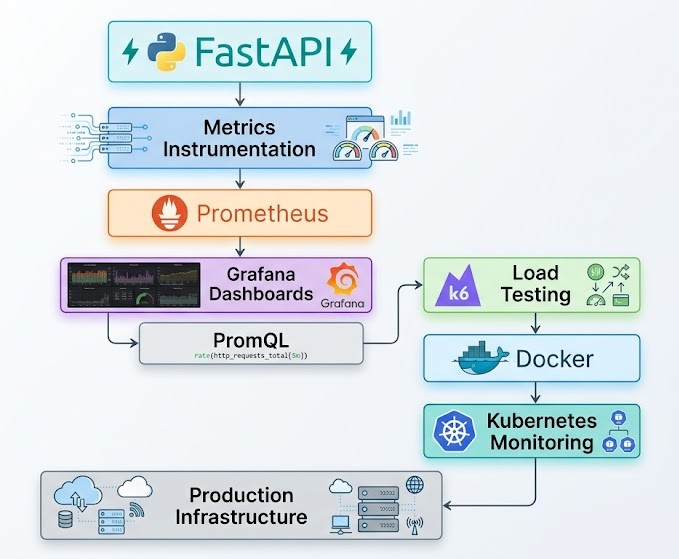
- FastAPI
- Prometheus
- Grafana
- k6
engineers can simulate production traffic and analyze system behavior scientifically.
Key Observability Metrics
| Metric | Purpose |
|---|---|
| Request Rate | Traffic volume over time. |
| Error Rate | Tracks failures and exceptions. |
| Latency | Measures response time. |
| CPU Usage | Infrastructure resource usage. |
| Memory Usage | Memory pressure analysis. |
| Throughput | System processing capacity. |
Observability Learning Roadmap
Best Practices
- Instrument applications early.
- Monitor latency instead of only uptime.
- Use labels carefully to avoid metric explosion.
- Track p95 and p99 response times.
- Build dashboards around business critical metrics.
- Combine monitoring with load testing.
Conclusion
Modern backend engineering is no longer just about building APIs. It is about understanding how systems behave under real traffic and maintaining reliability at scale.
By learning Prometheus and Grafana, engineers gain the ability to observe, analyze, and optimize systems using real production metrics.
Observability is becoming a core engineering skill for backend systems, cloud infrastructure, Kubernetes environments, and AI platforms.
As distributed systems continue to grow in complexity, engineers who understand monitoring and performance analysis will become increasingly valuable.
Zisanur Haque
Technical Product Architect & Product Engineer